How Financial Charts Help Crypto Traders


Trading crypto presents a unique set of complex challenges, with higher levels of volatility than other asset classes and a seemingly infinite universe of digital currencies to trade. Deciding what and when to buy — and, crucially, when to sell — is particularly complicated.
Fortunately, financial charts provide a powerful way for crypto traders to master these challenges. By using charts, traders gain a clearer picture of market trends. Charts enable traders to make informed trading and portfolio risk management decisions by leveraging technical analysis.
Charts are a fundamental aspect of trading all asset classes and have been used by traders for over a century; charts on the benchmark Dow Jones stock index were first published in 1896. Although crypto has a much shorter history, the fundamental investment principles behind the asset class are the same: is a particular cryptocurrency on an upward or downward trajectory? Has it remained range bound for some time? What are the support and resistance levels? Charts can provide insight into all of these questions.
Crypto traders can leverage charts in a variety of ways to identify crypto price trends, but especially common applications include:
- Price comparison within and across periods. Crypto traders can compare one period’s opening and closing prices to understand the market sentiment. Comparing prices across different periods, meanwhile, helps crypto traders understand price movement and analyze market trends.
- Price component analysis. Financial charts can dissect various price components, such as open, high, low, and close, enabling crypto traders to understand buyers’ and sellers’ action during a specific period.
- Market trend identification. By identifying price patterns from financial charts, crypto traders can predict what the market could do next, and frame their trading strategy accordingly.
A simple list of numbers can be difficult to conceptualize, but transforming those digits into a chart makes it easier to understand the supply and demand dynamics of a particular digital asset. This in turn enables investors to make better judgments about the likely future performance of a single crypto, or even about the broader market.
Types of Chart
To help traders gain a full understanding of the market and make informed decisions, Devexperts has provided DXcharts, an HTML5 financial charting library.
Each of DXcharts’ 11 user-friendly chart formats offers a different insight into the crypto market.
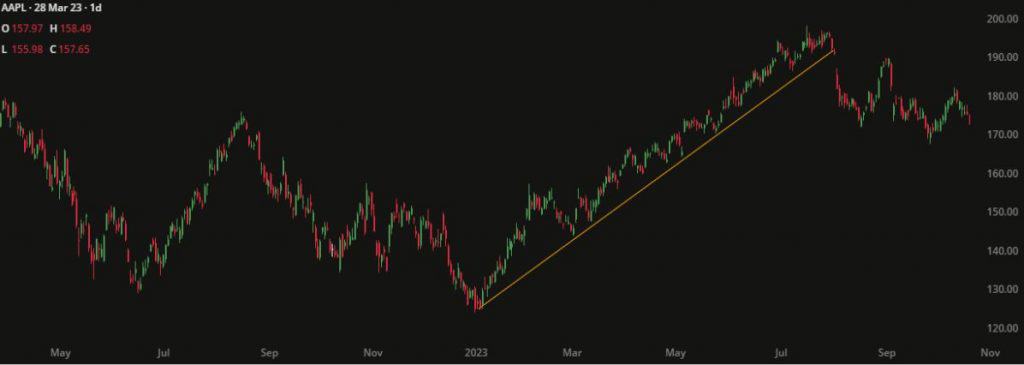
In the commonly used Candle chart, also known as a Candlestick chart, a “body” and “wick” represent the price of each given period. The body represents the opening and closing prices, while the wick shows high and low prices. The candle is green if the period’s closing price is higher than its opening price, and red if the period’s closing price is lower than its opening price.
A Candle chart’s ability to convey a crypto’s price movement over time allows traders to gauge its momentum, decide whether to trade, and identify appropriate entry and exit points based on support and resistance levels.
Bar chart
In the Bar chart, a vertical line represents each price bar. Crypto traders can use Bar charts to identify price patterns and ascertain market trends by analyzing the relative differences in the data of different periods.
Line chart
The Line chart provides a visual representation of closing prices of successive periods with no open, high, or low prices. The lines are green if the closing price of the current period is higher than the closing price of the previous period, and are red otherwise. Line charts help crypto traders ascertain price increases during a specified period, and analyze the prevailing market sentiment to capitalize on the price momentum.
Area chart
The Area chart is a variant of a Line chart and represents the closing price values. It plots the area between the closing price and the zero price level. Area charts help crypto traders ascertain significant volume or price activity during a period, thereby emphasizing the relative value changes to determine the current market trend.
Equivolume chart
The Equivolume chart combines price and volume. Each candle’s width represents the volume, while the boundaries at the two ends represent the high and low prices. Equivolume charts enable crypto users to gauge the strength of a price move. A wider and longer price bar generally suggests a price move supported by an increased volume. It results in a larger price move, which increases conviction in the market trend.
Heikin-Ashi chart
The Heikin-Ashi chart is a variant of the Candle chart in which average prices are used to filter out the market noise. It provides a clearer picture of market trends. Crypto traders can use Heikin-Ashi charts to identify market trends and spot potential price reversals. Contra trades can result in a highly favorable reward due to minimum risk, as the entry point tends to be near the reversal point.
Scatter chart
The Scatter chart displays closing price values as scattered dots on the chart, without any connecting lines. Crypto traders can use Scatter charts to spot outlier price values and price gaps and establish correlations between different variables.
Hollow Candle chart
The Hollow Candle chart is similar to the Candle chart, with one important difference: the body of each candle can be displayed as either hollow or filled. The candle is hollow if the closing price is higher than the opening price, and is filled otherwise. Meanwhile, the candle is green if the current closing price is higher than the previous closing price, and red otherwise.
With the Hollow Candle chart, crypto traders can compare closing prices of different periods, and gauge market sentiment and trends.
Histogram chart
The Histogram chart represents the distribution of data. The vertical chart bars represent the price interval, while the height of each bar exhibits the trade or volume frequency.
Crypto traders can use Histogram charts to spot areas of high trading activity and ascertain the buying and selling zones to enter and exit their trades.
Baseline chart
The Baseline chart involves plotting price movements relative to a specific price level, known as the baseline. It exhibits price deviations from the concerned norm.
Crypto traders can use Baseline charts for mean-reversion strategies or to identify breakouts. Price breakouts from the baseline, when accompanied by increased volume, often lead to explosive price moves, resulting in high rewards.
Trend chart
The Trend chart is a graphical representation in which candles are filled based on open and close prices of the current period. The borders of the candles are colored based on the close prices of the current period in comparison to those of the previous period. Trend charts help crypto traders to spot market trends by identifying patterns in data over time, and thereby enable them to effectively plan the entry and exit points for their trades.
DXcharts Features
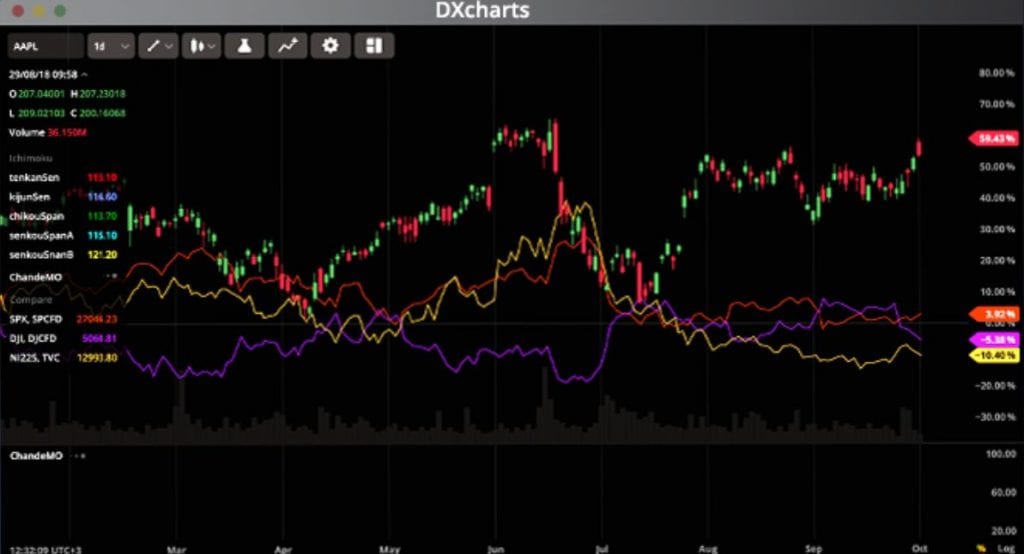
In addition to its data visualization capabilities, DXcharts offers over 100 indicators and 42 drawings and provides a wide range of special features that crypto traders can leverage to gain an even more sophisticated understanding of the market.
For example, users can overlay multiple charts, perform regular, percentage, or logarithmic analyses, and customize date ranges. Traders can also search by instrument to gain insight into general trading conditions by accessing data such as the number of open positions in a particular crypto, the volume of active orders, and what order types other market participants are using.
Users can even import market data from the provider of their choice, and export the resulting charts. This enables finfluencers to seamlessly share their customized data visualizations on social media, and create a following based on their newly honed crypto chart skills!
Furthermore, DXcharts includes a wide range of drawings, chart annotation labels, and advanced tools that enable the calculation of indicators like Fibonacci Retracements and Regression Trends.
To make its tools even more user-friendly, DXcharts recently integrated ChatGPT into its chart functionality, streamlining traders’ workflow by enabling them to efficiently get information about chart components all in one place.
For Crypto Brokers
Now that you know how many benefits financial charts bring to crypto traders, it’s time to take the next step. Visit the DXcharts demo page, and see how Devexperts can take your crypto trading business to the next level!
Disclaimer
In line with the Trust Project guidelines, please note that the information provided on this page is not intended to be and should not be interpreted as legal, tax, investment, financial, or any other form of advice. It is important to only invest what you can afford to lose and to seek independent financial advice if you have any doubts. For further information, we suggest referring to the terms and conditions as well as the help and support pages provided by the issuer or advertiser. MetaversePost is committed to accurate, unbiased reporting, but market conditions are subject to change without notice.
About The Author
Gregory, a digital nomad hailing from Poland, is not only a financial analyst but also a valuable contributor to various online magazines. With a wealth of experience in the financial industry, his insights and expertise have earned him recognition in numerous publications. Utilising his spare time effectively, Gregory is currently dedicated to writing a book about cryptocurrency and blockchain.
More articles
Gregory, a digital nomad hailing from Poland, is not only a financial analyst but also a valuable contributor to various online magazines. With a wealth of experience in the financial industry, his insights and expertise have earned him recognition in numerous publications. Utilising his spare time effectively, Gregory is currently dedicated to writing a book about cryptocurrency and blockchain.