Bitcoin Markets: Three trade setups for BTC traders, but is $20,000 still a reasonable prediction
In Brief
A clear break above this resistance area could lead BTC toward the $19,000 region.
A clear break below the $15,462 support level could invalidate the bullish thesis put forward in this analysis.
Bitcoin price is trading inside a symmetrical triangle pattern on its four-hour chart. The digital asset is currently caught in consolidation mode above the $16,450 support level. A clear break below the $15,462 support level could invalidate the bullish thesis put forward in this analysis.

Bitcoin price is showing a few positive signs above $16,500 against the US Dollar. BTC remains at risk of more losses below $16,000 unless it clears the $17,000 hurdle.
Bitcoin is slowly moving higher and consolidating above the $16,500 level. The price traded as low as $16,206, and it is currently correcting higher. There was a break above the $16,400 level, but the price failed to gain strength above the $16,700 zone. There was also a bearish reaction below the $17,000 level, and the price recently tested the 100 hourly simple moving average.
The 23.6% Fib retracement level is currently correcting higher. There was a break above the $16,400 level, but the price failed to gain strength above the $16,700 zone. There was also a bearish reaction below the $17,000 level, and the price recently tested the 100 hourly simple moving average.
A high was formed near $17,185, and the price started a downside correction. It declined below the $16,900 level and tested the $16,500 support. The 50% Fib retracement level of the upward move from the $16,206 low to the $17,185 high is also acting as a support.
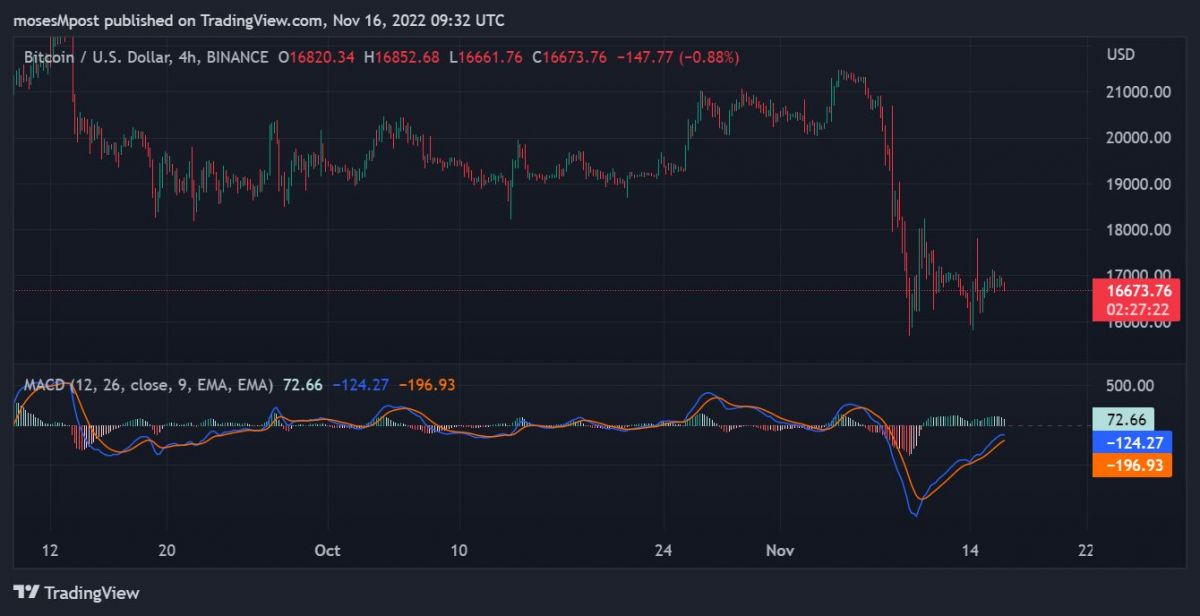
As seen on the four-hour chart, Bitcoin price is currently trading inside a symmetrical triangle pattern. This consolidation phase is taking place after the coin surged higher from the $15,462 support area. The triangle pattern is a continuation formation that usually leads to a breakout in the direction of the previous trend. In this case, the previous trend was bullish since BTC surged from $15,462 to $17,600.
Therefore, there’s a higher chance that Bitcoin price will soon break out of the triangle pattern to resume its uptrend. The first target for the bulls is likely to be near the $17,600 resistance area.
A clear break above this resistance area could lead BTC toward the $19,000 region. This is a crucial juncture for Bitcoin bulls as a close above $19,000 is needed to push BTC toward its previous resistance level of $20,000 level.
What do technicals suggest about BTC?
The four-hour chart for BTC/USD suggests that the cryptocurrency is currently caught in a consolidation phase. A clear break below the $15,462 support level could invalidate the bullish thesis put forward in this analysis.

The RSI indicator is currently well above the 50 level, which suggests that bulls are in control. However, the MACD indicator is losing momentum and is close to entering bearish territory. If the MACD indicator does make a bearish crossover, it would suggest that bears are trying to take control of the market. In such a case, Bitcoin price could decline towards the $15,462 support level.
On the other hand, a move above the $17,600 resistance level would open the doors for a rally toward the $19,000 region. Let’s take a closer look at technical analysis and see what the three possible scenarios could play out for BTC in the near term.
Conclusion
A clear break above this resistance area could lead BTC toward the $19,000 region. This is a crucial juncture for Bitcoin bulls as a close above $19,000 is needed to push BTC toward the $20,000 level. The current technical setup suggests that Bitcoin price is likely to resume its uptrend in the near term. However, a clear break below the $15,462 support level could invalidate this bullish thesis.
Related articles:
- FTX collapse: Metaverse and NFT projects at risk?
- Bitcoin Market: Elon Musk is bullish on BTC
- Dogecoin Markets: Musk’s Twitter deals nearing closure, could DOGE explode 10x?
Disclaimer
In line with the Trust Project guidelines, please note that the information provided on this page is not intended to be and should not be interpreted as legal, tax, investment, financial, or any other form of advice. It is important to only invest what you can afford to lose and to seek independent financial advice if you have any doubts. For further information, we suggest referring to the terms and conditions as well as the help and support pages provided by the issuer or advertiser. MetaversePost is committed to accurate, unbiased reporting, but market conditions are subject to change without notice.
About The Author
Moses is an experienced freelance writer and analyst with a keen interest in how technology is disrupting the financial sector. He has written extensively on the subject of cryptocurrencies from an investment perspective, as well as from a technical standpoint. He has also been involved in trading cryptocurrencies for over two years.
More articlesMoses is an experienced freelance writer and analyst with a keen interest in how technology is disrupting the financial sector. He has written extensively on the subject of cryptocurrencies from an investment perspective, as well as from a technical standpoint. He has also been involved in trading cryptocurrencies for over two years.


